Broken Connectivity
Time estimate: 30 minutes
The connectivity between entities in a network might get lost for various reasons, such as hardware issues, application failures, and misconfiguration of services. In this exercise, we mainly focus on the connectivity failures caused by the misconfiguration of SCION services.
You will work through two separate tasks. In each of these tasks, you are first asked to execute a given script which prepares the setup for the corresponding task by applying some changes which result in the lack of connectivity between some parts of the network. The goal of each task is to teach you how to find out about the occurrence of such connectivity issue, figure out what is causing it, and then finally resolve it.
Overview
Refer to the diagram below, which visualizes the network topology we work on in this hands-on session. The depicted infrastructure consists of an ISD, called Finance ISD, which has three ASes:
- Webspeed (ISD-AS 1-ff00:1:1)
- Corpbank Switzerland (ISD-AS 1-ff00:1:2)
- Stabank Private Banking (ISD-AS 1-ff00:1:3)
The Webspeed AS consists of three sites in Zurich, Geneva, and Lugano. Each of these sites includes
exactly one host. These hosts are called core.zurich.webspeed, core.geneva.webspeed, and
core.lugano.webspeed, respectively. This is a core AS.
The Corpbank Switzerland AS has two sites, one in Geneva and one in Zurich. Both of them have a
host, respectively called edge.zurich.corpbank and edge.geneva.corpbank. Furthermore, the
Stabank Private Banking AS includes only one site, in Lugano, with one host, called
edge.lugano.stabank. They are both leaf ASes and each of them is connected to the Webspeed AS via
two links, as depicted in the diagram below and here for a fullscreen
view.
Over the course of this lab, you will be working in a cloud-hosted playground of the SCION infrastructure. All the ASes run in a virtualized environment on a cloud machine.
Task 1. Link Failure
Time estimate: 15 minutes
To get started with this task, you first need to run:
operator@training:~/workspace$ ./appliance_broken_connectivity_exercise setup_first
This command will execute a script which applies some changes that result in a connectivity issue. The purpose of this task is to teach you how to find and fix that issue.
If you need to revert the changes made by the above command at any time during this exercise, you can run the following command:
operator@training:~/workspace$ ./appliance_broken_connectivity_exercise restore
After the preparation made by executing the script, one of the links between the Webspeed AS and the Stabank AS should be down. In practice, you should be informed of such a problem via an alerting system that sits on top of your monitoring endpoints. We do not have such an alerting system in place in our training setup, but instead you can check the monitoring endpoints directly by yourself. (Please see Monitoring for more details on how to access and investigate the monitoring data.)
Open the CORE Overview dashboard and check the monitoring data. In particular, if you check the diagram with the title Interface State, it should be similar to the figure below.
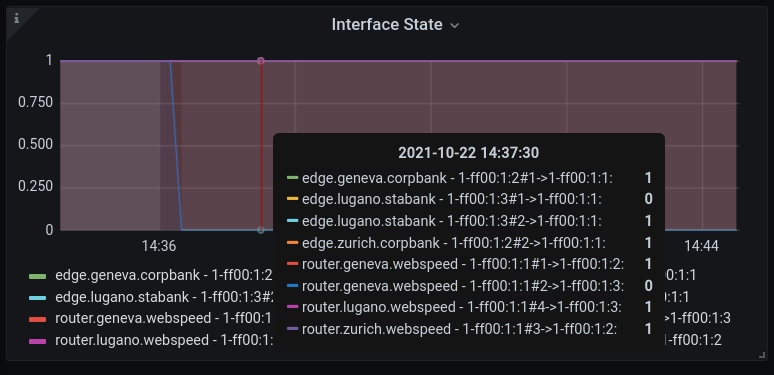
As you can observe in this diagram, the interfaces on one of the links between the Webspeed AS and
the Stabank AS are down. More precisely, the interface number 2 on the host
core.geneva.webspeed and the interface number 1 on the host edge.lugano.stabank are down.
As mentioned, in practice such an issue should ideally be brought to your attention through an alerting system or you might have just configured this link and want to check if it is up and running.
Thus, assume that you have become aware that this link is down in some way. To confirm this, run a
showpaths command from the host edge.lugano.stabank toward the Webspeed AS.
Solution
operator@training:~/workspace$ lxc shell edge-lugano-stabank
root@edge-lugano-stabank:~# scion showpaths 1-ff00:1:1
Available paths to 1-ff00:1:1
2 Hops:
[0] Hops: [1-ff00:1:3 2>4 1-ff00:1:1] MTU: 1472 NextHop: 10.8.0.1:30042 Status: alive LocalIP: 10.8.0.1
Instead of the expected two paths, showpaths only shows a single path to the Webspeed AS. If you
compare the output of the above command and the network diagram from above, you can observe that the
link which connects interface number 2 in the Webspeed AS to the interface number 1 in the
Stabank AS is down.
A natural starting point for troubleshooting here is to run an IP ping between the EDGE gateway
and the CORE at the Webspeed AS. If this works, it means that there is connectivity on the IP
underlay connecting the EDGE gateway to the SCION CORE router. In that case, we can guess that the
connectivity issue is on the SCION level. Note that if the ping command is not working either,
then it might be an issue with networking hardware. Covering such scenarios is out of scope for this
exercise.
Now, run the suitable ping command.
To find the IP to ping, carefully inspect the network diagram and find the IP
network that is connecting edge.lugano.stabank to the CORE in the
Webspeed AS.
Solution
root@edge-lugano-stabank:~# ping 169.254.1.4
PING 169.254.1.4 (169.254.1.4) 56(84) bytes of data.
64 bytes from 169.254.1.4: icmp_seq=1 ttl=64 time=0.512 ms
64 bytes from 169.254.1.4: icmp_seq=2 ttl=64 time=3.28 ms
64 bytes from 169.254.1.4: icmp_seq=3 ttl=64 time=7.02 ms
64 bytes from 169.254.1.4: icmp_seq=4 ttl=64 time=1.04 ms
^C
--- 169.254.1.4 ping statistics ---
4 packets transmitted, 4 received, 0% packet loss, time 3027ms
rtt min/avg/max/mdev = 0.512/2.967/7.023/2.562 ms
Considering the above output, it seems safe to conclude that we have a SCION connectivity issue. A natural next step is to check whether the failed link is configured correctly.
Download the configuration file for the host edge.lugano.stabank by running:
operator@training:~/workspace$ appliance-cli context select edge.lugano.stabank
operator@training:~/workspace$ appliance-cli get config > edge.lugano.stabank.appliance.json
Find the configuration data for the failed link, i.e., the one which connects interface 2 in the
Webspeed AS to interface 1 in the Stabank AS. Then, check if it is configured correctly. In
particular, examine if the configuration data matches the data in the network diagram from above.
Solution
You need to check the section scion.ases.neighbors, which looks like:
As you perhaps have noticed, everything seems to be configured correctly, except that there is a
typo in the remote/address section of the interface whose interface_id is equal to 1. (Recall
that this is the interface which is down on this host.) Thus, we need to replace 169.252.1.4 with
the correct IP address 169.254.1.4.
Fix Misconfiguration
Now that you found the misconfiguration which probably has caused the issue, go ahead and fix it and then apply it by running:
operator@training:~/workspace$ appliance-cli put config <edge.lugano.stabank.appliance.json
It is time to check whether the issue has been resolved and the connectivity is back. Check the Interface State diagram in the monitoring endpoints again. It should be similar to the diagram below.
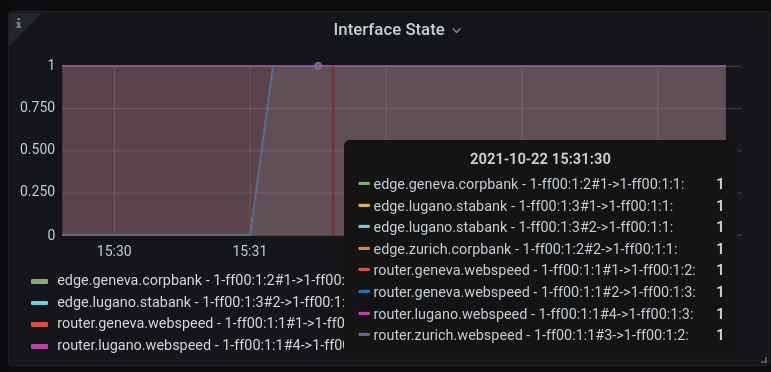
As you can see all the interfaces are up now.
Finally, run the showpaths command toward the Webspeed AS.
Solution
operator@training:~/workspace$ lxc shell edge-lugano-stabank
root@edge-lugano-stabank:~# scion showpaths 1-ff00:1:1
Available paths to 1-ff00:1:1
2 Hops:
[0] Hops: [1-ff00:1:3 1>2 1-ff00:1:1] MTU: 1472 NextHop: 10.8.0.1:30042 Status: alive LocalIP: 10.8.0.1
[1] Hops: [1-ff00:1:3 2>4 1-ff00:1:1] MTU: 1472 NextHop: 10.8.0.1:30042 Status: alive LocalIP: 10.8.0.1
As expected, the path corresponding to the misconfigured link is up and running now.
Task 2. Ping Failure
Time estimate: 15 minutes
To get started with this task, you first need to run:
operator@training:~/workspace$ ./appliance_broken_connectivity_exercise setup_second
This command will execute a script which applies some changes that result in a connectivity issue. The purpose of this task is to teach you how to find and fix that issue.
If you need to revert the changes made by the above command at any time during this exercise, you can run the following command:
operator@training:~/workspace$ ./appliance_broken_connectivity_exercise restore
Assume that you have just configured the end host in the Stabank AS and want to check if it is set up correctly. (Please see the network diagram from above.)
Log into this end host and run a ping command toward the end host in the Corpbank AS. Check the
network diagram to find the IP of the end host in the the Corpbank AS.
Solution
operator@training:~/workspace$ lxc shell endhost-lugano-stabank
root@endhost-lugano-stabank:~# ping 10.2.0.3 -w 5
PING 10.2.0.3 (10.2.0.3) 56(84) bytes of data.
From 10.8.0.2 icmp_seq=1 Destination Host Unreachable
--- 10.2.0.3 ping statistics ---
5 packets transmitted, 0 received, +1 errors, 100% packet loss, time 4092ms
Note that the IP address 10.2.0.3 is derived from the network diagram. The failed ping indicates
that the other end host is not reachable.
Similarly, log into the end host in the Corpbank AS and run a ping command toward the end host in
the Stabank AS.
Solution
operator@training:~/workspace$ lxc shell endhost-zurich-corpbank

root@endhost-zurich-corpbank:~# ping 10.8.0.2 -w 5
PING 10.8.0.2 (10.8.0.2) 56(84) bytes of data.
--- 10.8.0.2 ping statistics ---
7 packets transmitted, 0 received, 100% packet loss, time 6131ms
The end host in the Stabank AS is not reachable from the endhost in the Corpbank AS.
It is worth emphasizing that in practice you might be in charge of operating the Stabank AS but not
the Corpbank AS. In that case, you will not have the option to run the ping command from the
Corpbank end host. However, the fact is that we do not really need to have access to the Corpbank AS
hosts to find the issue and resolve it, as you will see. Thus, the commands which are run from the
Corpbank AS side are just meant to give you a better understanding. Furthermore, it indicates that
even though the issue is on the Stabank side, it could be discovered from the Corpbank side as well.
Next, check what is the status for the SCION connectivity by running the showpaths command from
the host edge.lugano.stabank toward the Corpbank AS.
Solution
operator@training:~/workspace$ lxc shell edge-lugano-stabank

root@edge-lugano-stabank:~# scion showpaths 1-ff00:1:2
Available paths to 1-ff00:1:2
3 Hops:
[0] Hops: [1-ff00:1:3 1>2 1-ff00:1:1 1>1 1-ff00:1:2] MTU: 1472 NextHop: 10.8.0.1:30042 Status: alive LocalIP: 10.8.0.1
[1] Hops: [1-ff00:1:3 1>2 1-ff00:1:1 3>2 1-ff00:1:2] MTU: 1472 NextHop: 10.8.0.1:30042 Status: alive LocalIP: 10.8.0.1
[2] Hops: [1-ff00:1:3 2>4 1-ff00:1:1 1>1 1-ff00:1:2] MTU: 1472 NextHop: 10.8.0.1:30042 Status: alive LocalIP: 10.8.0.1
[3] Hops: [1-ff00:1:3 2>4 1-ff00:1:1 3>2 1-ff00:1:2] MTU: 1472 NextHop: 10.8.0.1:30042 Status: alive LocalIP: 10.8.0.1
As you see, all SCION paths between the two ASes are operational.
Another piece of information which could be very helpful to discover the cause of broken connectivity here is the network prefixes announced by the AS and prefixes learned from the remote ASes. Such information is exposed as an HTTP status page.
Inspect the relevant HTTP status page in the host edge.lugano.stabank.
Recall from the IP-in-SCION Tunneling: Basics tutorial that the SGRP status can be accessed by running the following commands on the host that runs the SCION gateway:
appliance-cli get debug/scion-tunneling/sgrp/peers
appliance-cli get debug/scion-tunneling/sgrp/remote/receive
Solution
root@edge-lugano-stabank:~# appliance-cli get debug/scion-tunneling/sgrp/peers
{
  peers: [
    {
      announced: ["10.8.0.2/32", "10.8.0.5/32"]
      last_received: "2026-01-21T11:06:27Z"
      local_isd_as: "1-ff00:1:3"
      path: "1-ff00:1:3 2>4 1-ff00:1:1 1>1 1-ff00:1:2"
      received: ["10.2.0.3/32"]
      remote_address: "10.2.0.1:40200"
      remote_isd_as: "1-ff00:1:2"
    }
    {
      announced: ["10.8.0.2/32", "10.8.0.5/32"]
      last_received: "2026-01-21T11:06:27Z"
      local_isd_as: "1-ff00:1:3"
      path: "1-ff00:1:3 2>4 1-ff00:1:1 3>2 1-ff00:1:2"
      received: ["10.2.0.3/32"]
      remote_address: "10.2.0.2:40200"
      remote_isd_as: "1-ff00:1:2"
    }
  ]
}

root@edge-lugano-stabank:~# appliance-cli get debug/scion-tunneling/sgrp/remote/receive
{
  1-ff00:1:3,1-ff00:1:2,10.2.0.1:40200: {
    accepted: {}
    candidates: ["10.2.0.3/32"]
    last_received: "2026-01-21T11:07:29Z"
    local_isd_as: "1-ff00:1:3"
    remote_address: "10.2.0.1:40200"
    remote_isd_as: "1-ff00:1:2"
  }
  1-ff00:1:3,1-ff00:1:2,10.2.0.2:40200: {
    accepted: {}
    candidates: ["10.2.0.3/32"]
    last_received: "2026-01-21T11:07:27Z"
    local_isd_as: "1-ff00:1:3"
    remote_address: "10.2.0.2:40200"
    remote_isd_as: "1-ff00:1:2"
  }
}
This indicates that we learn the correct prefix from both endpoints in
Corpbank (1-ff00:1:2). However, the set of prefixes after applying the
filters is empty. This can already shed some light on the source of the
connectivity issue.
Similarly, log into edge.zurich.corpbank and check the relevant status command.
Solution
operator@training:~/workspace$ lxc shell edge-zurich-corpbank

root@edge-zurich-corpbank:~# appliance-cli get debug/scion-tunneling/sgrp/peers
{
  peers: [
    {
      announced: ["10.2.0.3/32"]
      last_received: "2026-01-21T11:24:48Z"
      local_isd_as: "1-ff00:1:2"
      path: "1-ff00:1:2 2>3 1-ff00:1:1 2>1 1-ff00:1:3"
      received: ["10.8.0.2/32", "10.8.0.5/32"]
      remote_address: "10.8.0.1:40200"
      remote_isd_as: "1-ff00:1:3"
    }
  ]
}

root@edge-zurich-corpbank:~# appliance-cli get debug/scion-tunneling/sgrp/remote/receive
{
  1-ff00:1:2,1-ff00:1:3,10.8.0.1:40200: {
    accepted: {
      stabank: ["10.8.0.2/32", "10.8.0.5/32"]
    }
    candidates: ["10.8.0.2/32", "10.8.0.5/32"]
    last_received: "2026-01-21T11:25:36Z"
    local_isd_as: "1-ff00:1:2"
    remote_address: "10.8.0.1:40200"
    remote_isd_as: "1-ff00:1:3"
  }
}
On this side, we learn the correct prefixes and they are accepted by the filter.
Putting together all the information that we have collected so far, an educated guess is that the host in the Stabank AS is rejecting the prefixes advertised by the remote ASes is causing the connectivity issue.
Download the configuration of the host in the Stabank AS by running:
operator@training:~/workspace$ appliance-cli context select edge.lugano.stabank
operator@training:~/workspace$ appliance-cli get config > edge.lugano.stabank.appliance.json
Investigate the scion_tunneling section in the edge's configuration file. Check whether the
configuration data matches the information in the network diagram from above.
Solution
You need to check the scion_tunneling.domains section, which contains the following data:
Comparing this configuration data with the information in the network diagram, you will notice that
there is a mistake in the accept filter. The prefix 10.3.0.0/24 has been inserted instead
of 10.2.0.3/32.
Now that you found the misconfiguration which probably has caused the issue, go ahead and fix it and then apply it by running:
operator@training:~/workspace$ appliance-cli put config <edge.lugano.stabank.appliance.json
As a consequence of this fix, the list of learned prefixes in the host edge.lugano.stabank should
get updated. To check this, log into the host and check the HTTP page where the learned and
advertised prefixes are exposed by running:
operator@training:~/workspace$ lxc shell edge-lugano-stabank

root@edge-lugano-stabank:~# appliance-cli get debug/scion-tunneling/sgrp/peers
{
  peers: [
    {
      announced: ["10.8.0.2/32", "10.8.0.5/32"]
      last_received: "2026-01-21T11:31:18Z"
      local_isd_as: "1-ff00:1:3"
      path: "1-ff00:1:3 1>2 1-ff00:1:1 1>1 1-ff00:1:2"
      received: ["10.2.0.3/32"]
      remote_address: "10.2.0.1:40200"
      remote_isd_as: "1-ff00:1:2"
    }
    {
      announced: ["10.8.0.2/32", "10.8.0.5/32"]
      last_received: "2026-01-21T11:31:17Z"
      local_isd_as: "1-ff00:1:3"
      path: "1-ff00:1:3 2>4 1-ff00:1:1 3>2 1-ff00:1:2"
      received: ["10.2.0.3/32"]
      remote_address: "10.2.0.2:40200"
      remote_isd_as: "1-ff00:1:2"
    }
  ]
}

root@edge-lugano-stabank:~# appliance-cli get debug/scion-tunneling/sgrp/remote/receive
{
  1-ff00:1:3,1-ff00:1:2,10.2.0.1:40200: {
    accepted: {
      corpbank: ["10.2.0.3/32"]
    }
    candidates: ["10.2.0.3/32"]
    last_received: "2026-01-21T11:38:55Z"
    local_isd_as: "1-ff00:1:3"
    remote_address: "10.2.0.1:40200"
    remote_isd_as: "1-ff00:1:2"
  }
  1-ff00:1:3,1-ff00:1:2,10.2.0.2:40200: {
    accepted: {
      corpbank: ["10.2.0.3/32"]
    }
    candidates: ["10.2.0.3/32"]
    last_received: "2026-01-21T11:38:55Z"
    local_isd_as: "1-ff00:1:3"
    remote_address: "10.2.0.2:40200"
    remote_isd_as: "1-ff00:1:2"
  }
}
You can see that as a result of the fix you made, 10.2.0.3/32 has been added to list of learned
prefixes.
So far, we confirmed that the applied changes have come to effect. Now, let's check if the connectivity issue is actually resolved.
Log into the end host in the Stabank AS and run a ping command toward the end host in the
Corpbank AS.
Solution
operator@training:~/workspace$ lxc shell endhost-lugano-stabank

root@endhost-lugano-stabank:~# ping 10.2.0.3
PING 10.2.0.3 (10.2.0.3) 56(84) bytes of data.
64 bytes from 10.2.0.3: icmp_seq=1 ttl=61 time=0.759 ms
64 bytes from 10.2.0.3: icmp_seq=2 ttl=61 time=0.610 ms
64 bytes from 10.2.0.3: icmp_seq=3 ttl=61 time=0.502 ms
64 bytes from 10.2.0.3: icmp_seq=4 ttl=61 time=0.538 ms
64 bytes from 10.2.0.3: icmp_seq=5 ttl=61 time=0.575 ms
^C
--- 10.2.0.3 ping statistics ---
5 packets transmitted, 5 received, 0% packet loss, time 4041ms
rtt min/avg/max/mdev = 0.502/0.596/0.759/0.093 ms
As you see, the ping command works as desired.
For the sake of completeness, log into the end host in the Corpbank AS and run a ping command
toward the end host in the Stabank AS.
Solution
operator@training:~/workspace$ lxc shell endhost-zurich-corpbank

root@endhost-zurich-corpbank:~# ping 10.8.0.2
PING 10.8.0.2 (10.8.0.2) 56(84) bytes of data.
64 bytes from 10.8.0.2: icmp_seq=1 ttl=61 time=17.3 ms
64 bytes from 10.8.0.2: icmp_seq=2 ttl=61 time=3.99 ms
64 bytes from 10.8.0.2: icmp_seq=3 ttl=61 time=5.06 ms
64 bytes from 10.8.0.2: icmp_seq=4 ttl=61 time=0.836 ms
64 bytes from 10.8.0.2: icmp_seq=5 ttl=61 time=13.7 ms
^C
--- 10.8.0.2 ping statistics ---
5 packets transmitted, 5 received, 0% packet loss, time 4033ms
rtt min/avg/max/mdev = 0.836/8.182/17.301/6.245 ms
As expected, this ping command succeeds as well.